Model use
There are two main uses of the projections:
Short-term projections (1 to 4 weeks) reflect the current level of COVID-19 transmission and current effectiveness of ongoing COVID-19 prevention and control. Short-term projections the immediate need health care such hospital and critical care services for COVID-19 patients.
Long-term projections (6 weeks onward) reflect sustain trends in COVID-19 transmissions. Long-term projections are helpful to assess the potential effect of COVID-19 re-opening or the need of increased restrictions to control surges.
Model accuracy
Short-term projections have a moderate amount of variation between modelling methods. Countries such as Germany and Poland and the United States address model variation by aggregation and ensemble hubs that combine projections from different science teams and modelling approaches. The approach used at 613covid.ca is commonly found within ensemble hubs. Typically, the approach used at 613covid.ca generates projects that fall within the middle to somewhat higher than the average ensemble projection during increasing COVID-19 transmission or somewhat lower than average during decreasing COVID-19 transmission.
Long-range projections have a lower accuracy than short-term projections as a consequence of changing COVID-19 control strategies. Long-term COVID-19 forecasting is similar to weather forecasting. It is difficult to predict when a hurricane will make landfall when it is still thousands of kilometers out at sea. Projections are updated with the latest data, including local data to help understand when and where the hurricane will reach landfall.
We can’t reliably forecast the weather six months out, and we can’t forecast COVID-19 six months out. However, we can reliably forecast COVID-19 two to four weeks into the future. Those short-term projections give us time to plan and increase health-care resources as needed.
That being said, hurricanes and COVID-19 are not the same. The path and force of a hurricane can’t be influenced, but the worst effects of COVID-19 can be avoided if we follow public health guidelines like staying home and practive physical distancing.
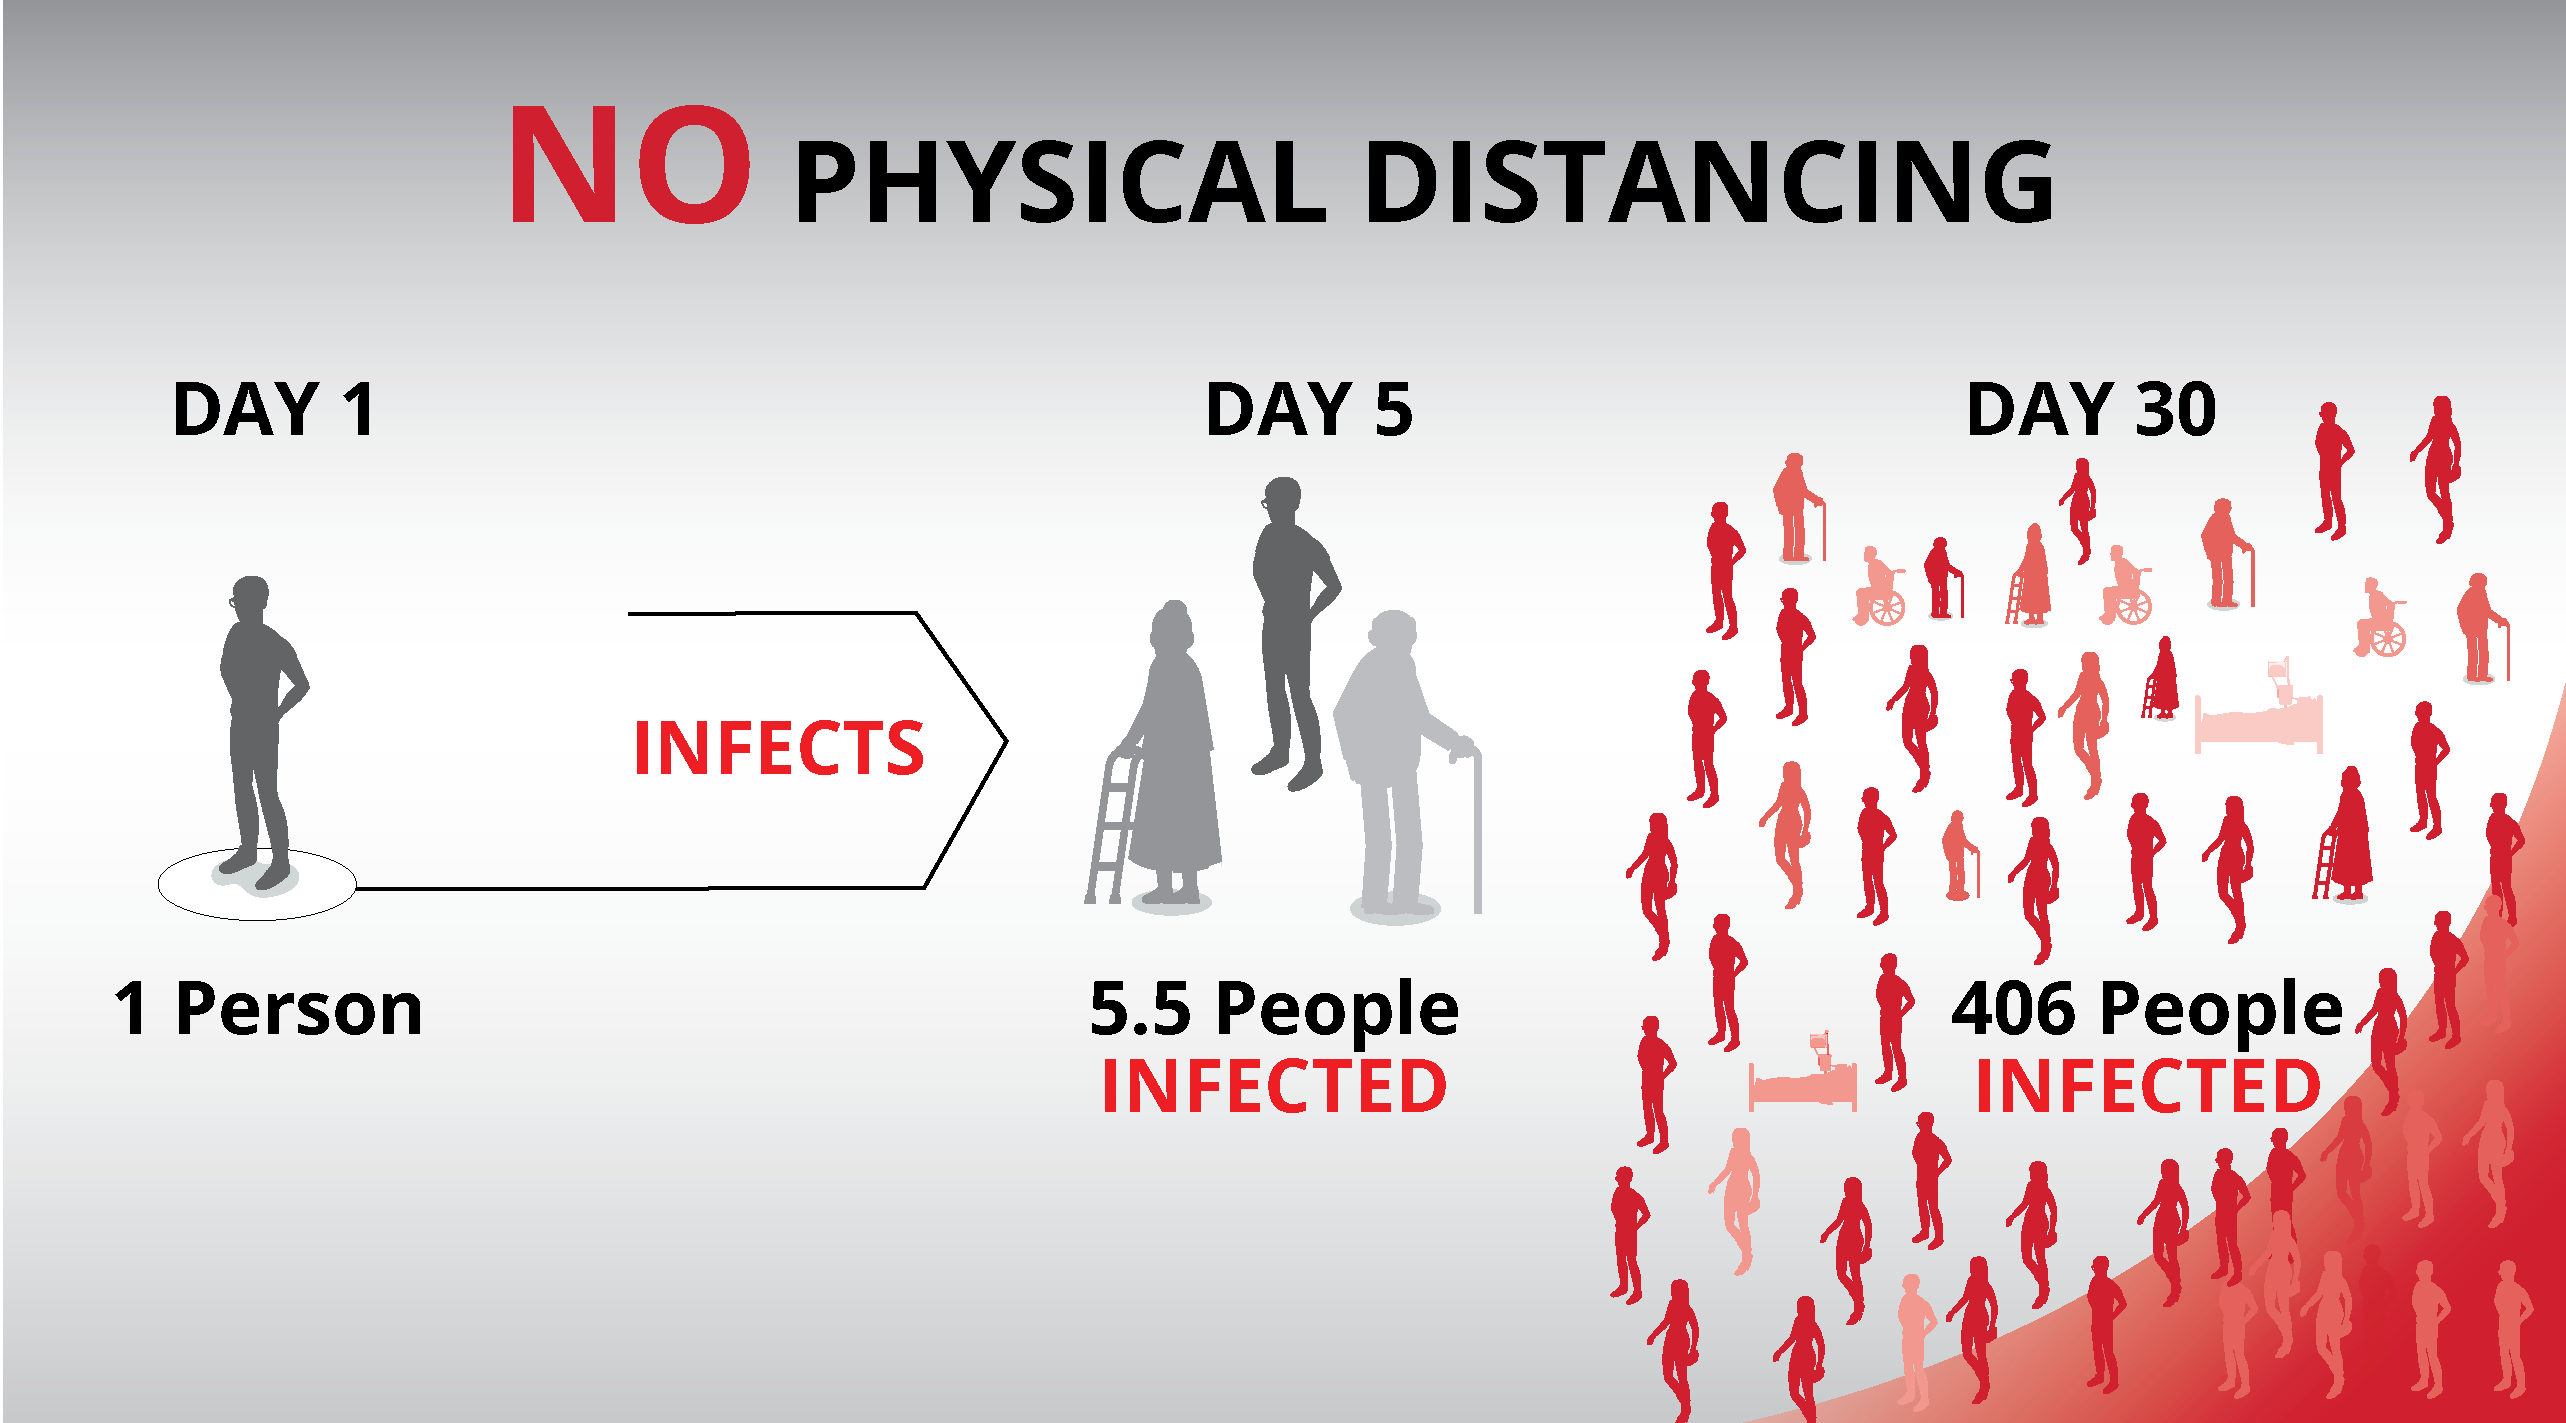
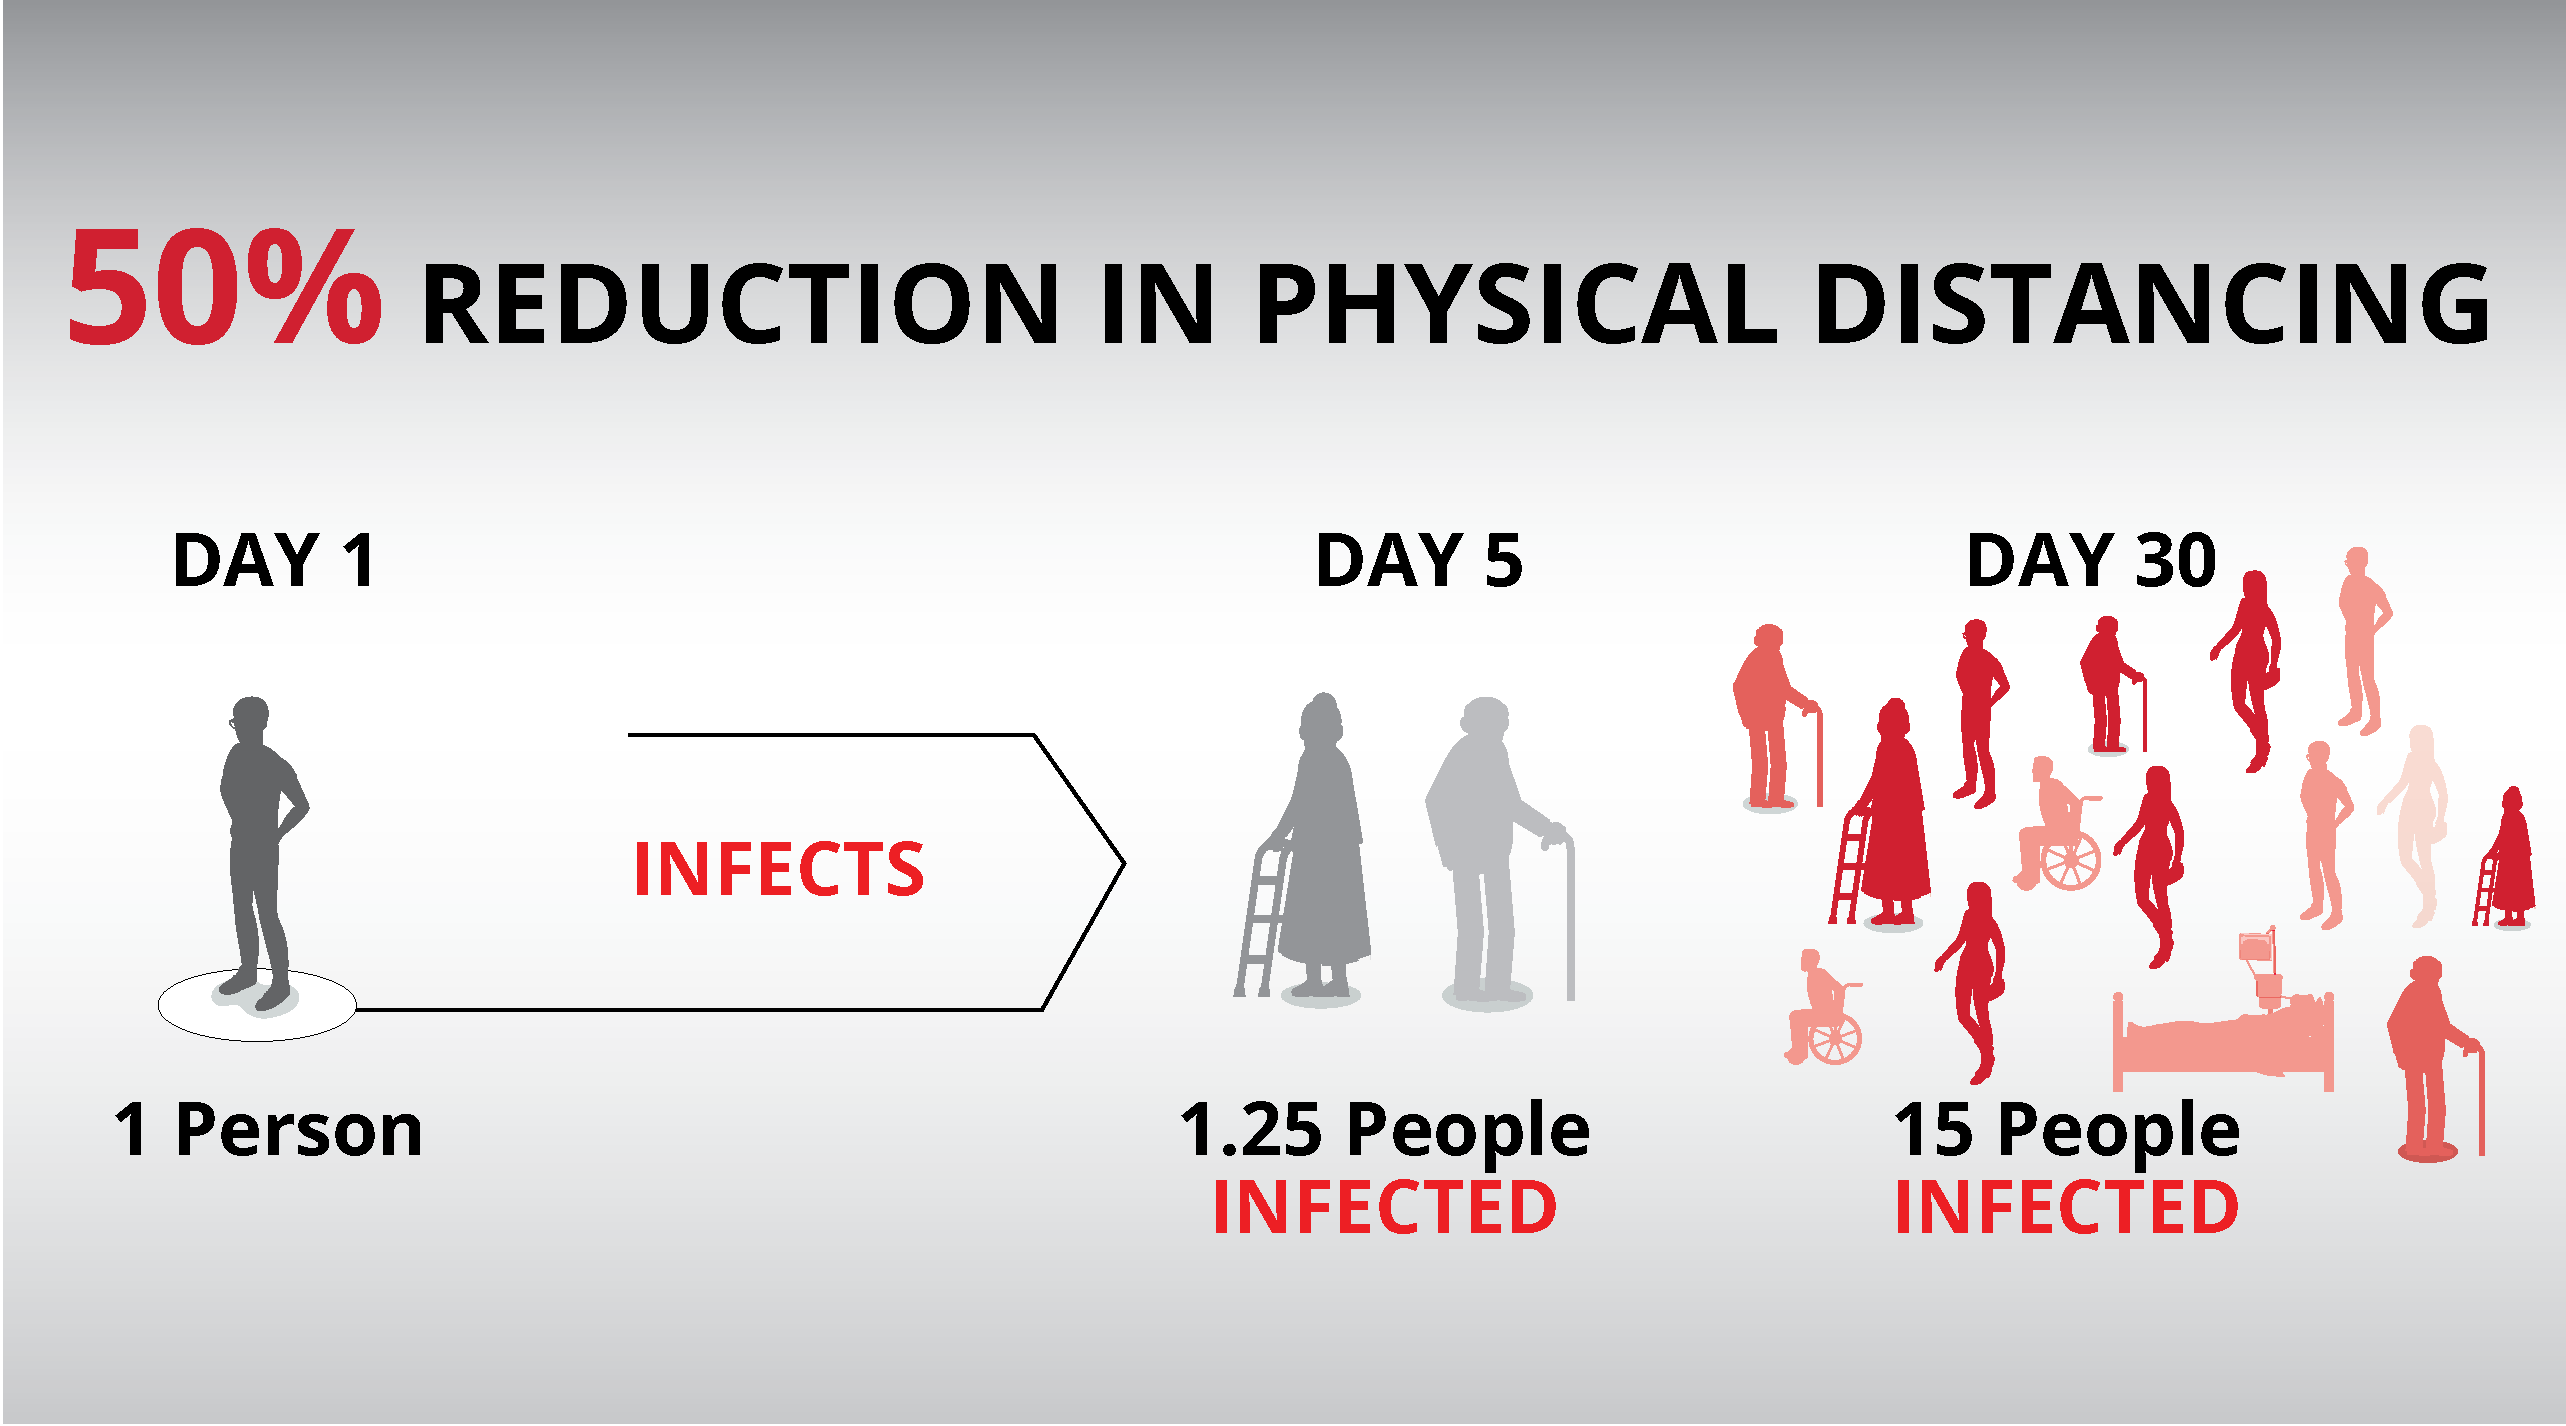
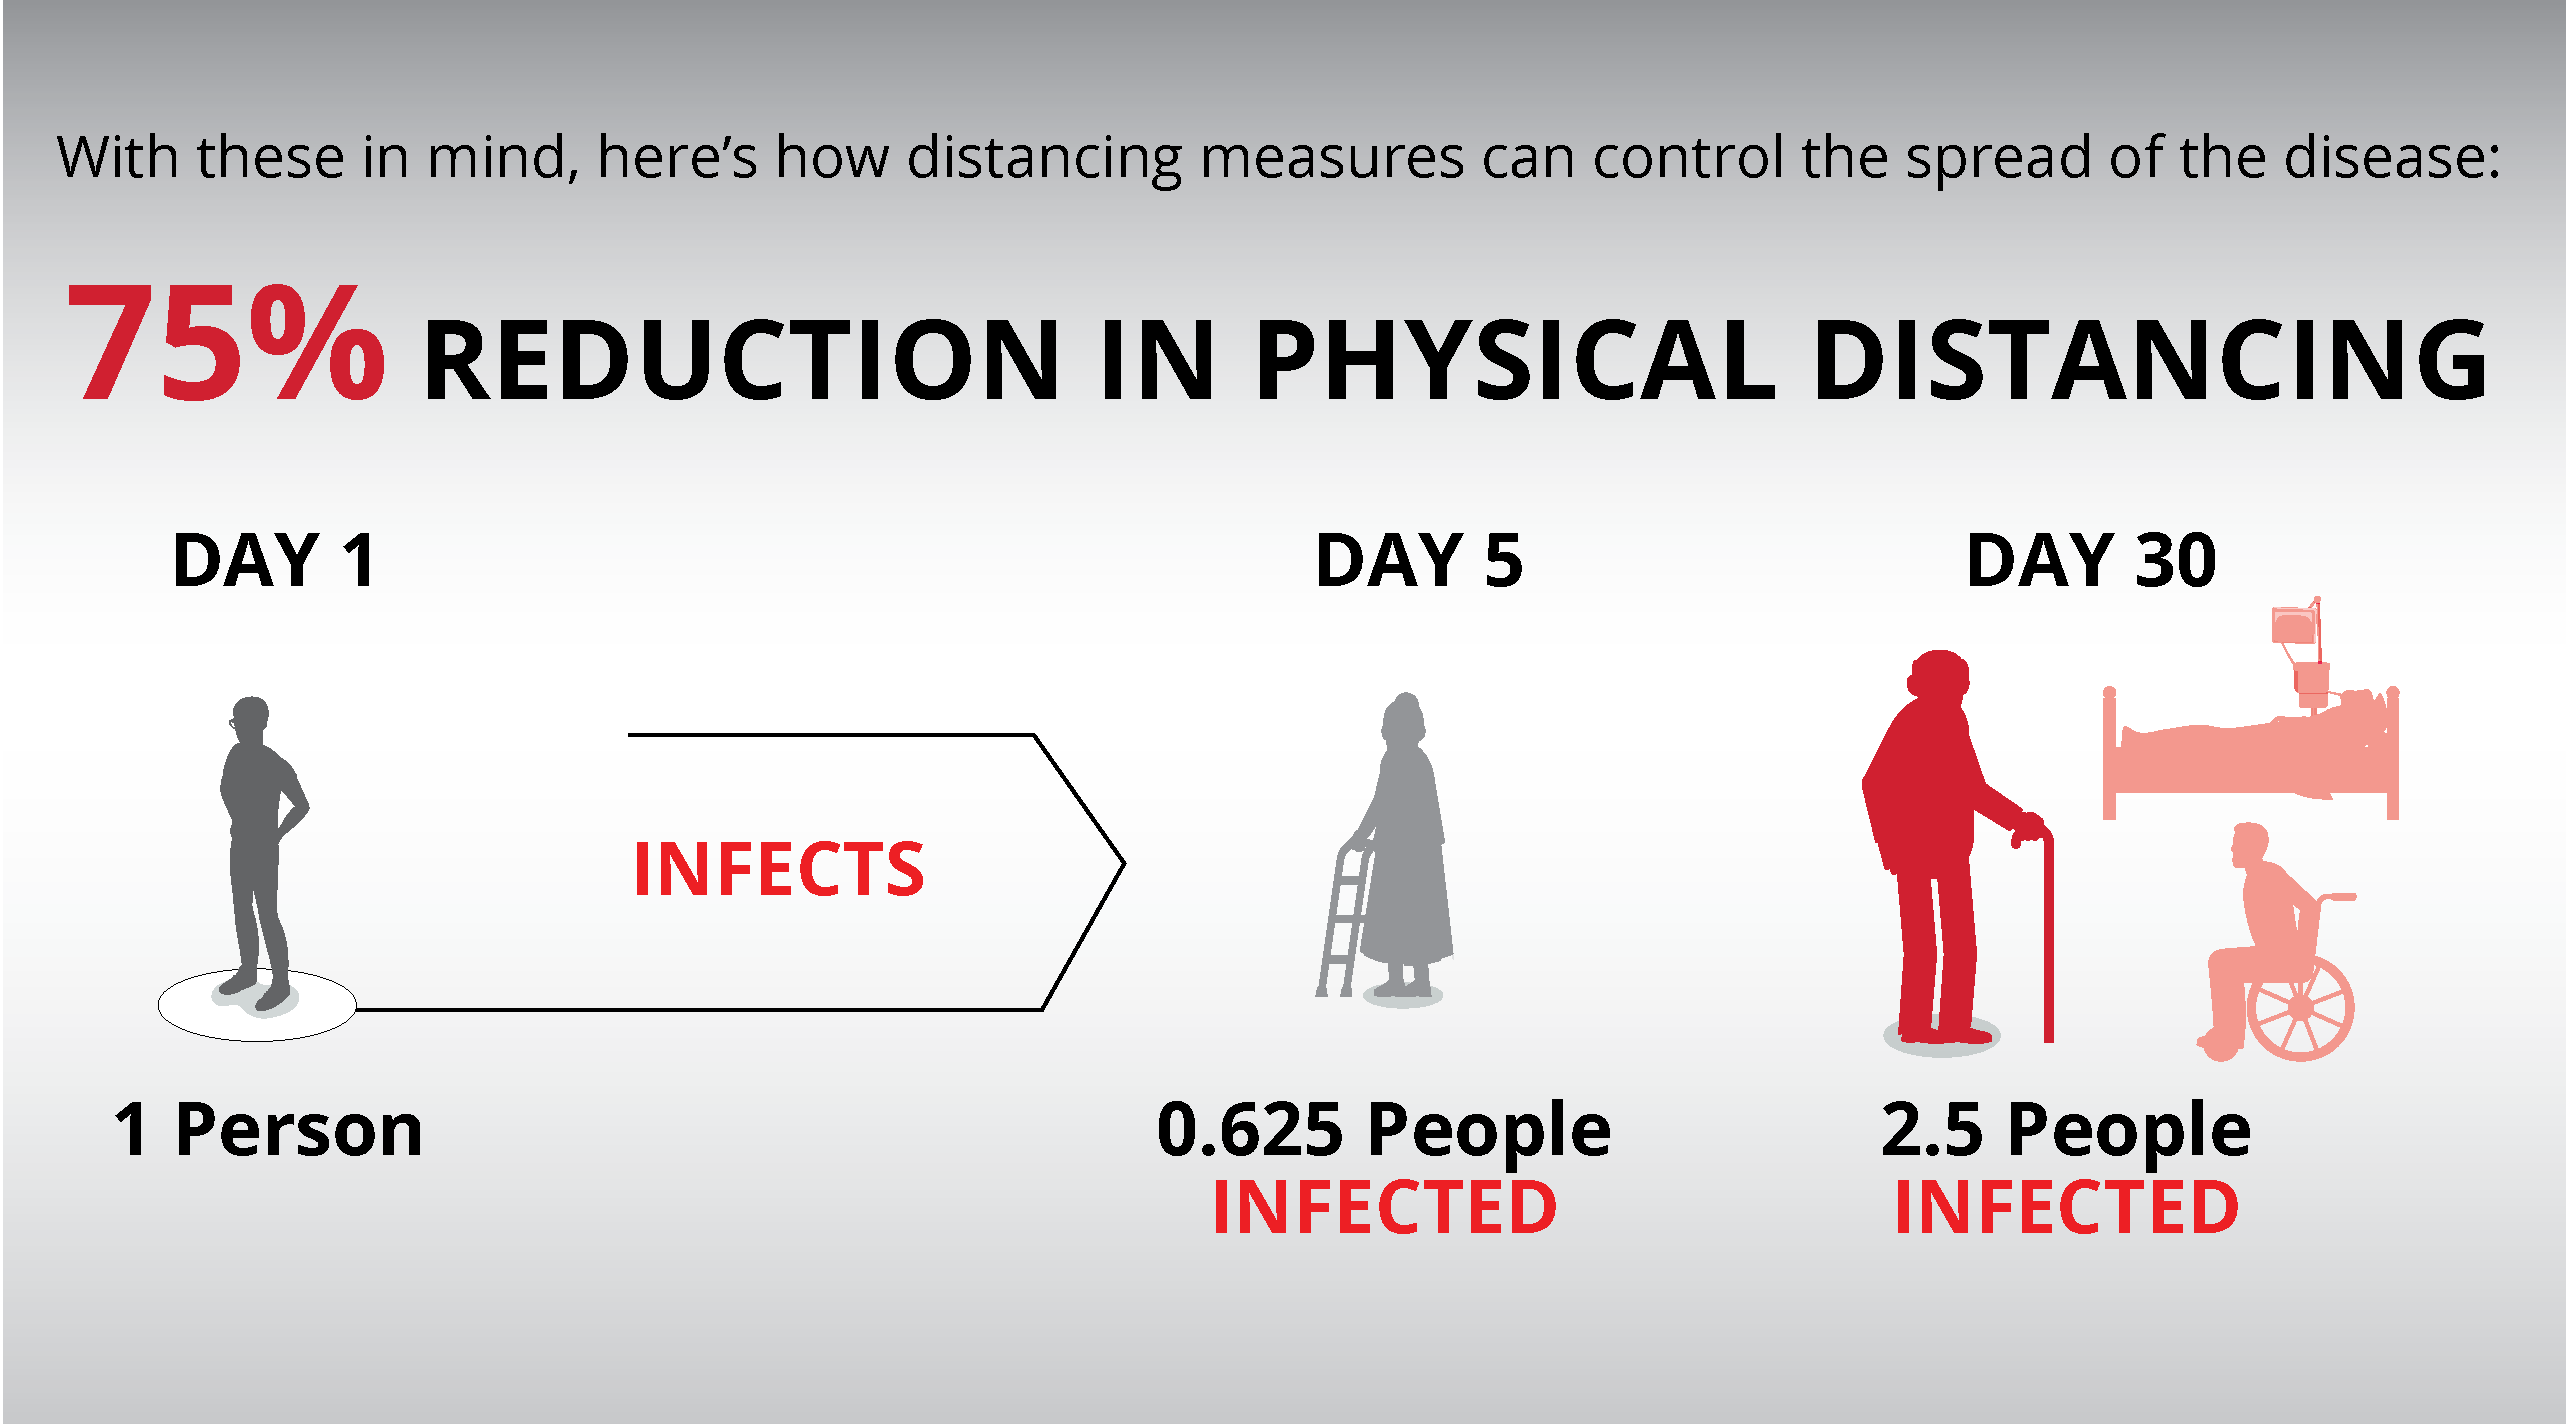
Scenarios of physical distancing
Physical distancing and other preventive measures susch as wearing masks are the most important factors for projecting long-range (1 to 4 months) COVID-19 cases and hospital use.
Public Health Ontario projected 100,000 COVID-19 Ontario deaths with no preventative measures and a lower estimate of 3,000 deaths with preventive measures This wide range of estimates (100,000 to 3,000 deaths) reflects different levels of physical distancing.
A high level of physical distancing will achieve a 97% reduction in deaths compared to a scenario of no preventive action (100,000 deaths). The wide range in projections is why we need to monitor and update Ottawa projections to reflect how well we achieve COVID-19 prevention.
Physical distancing
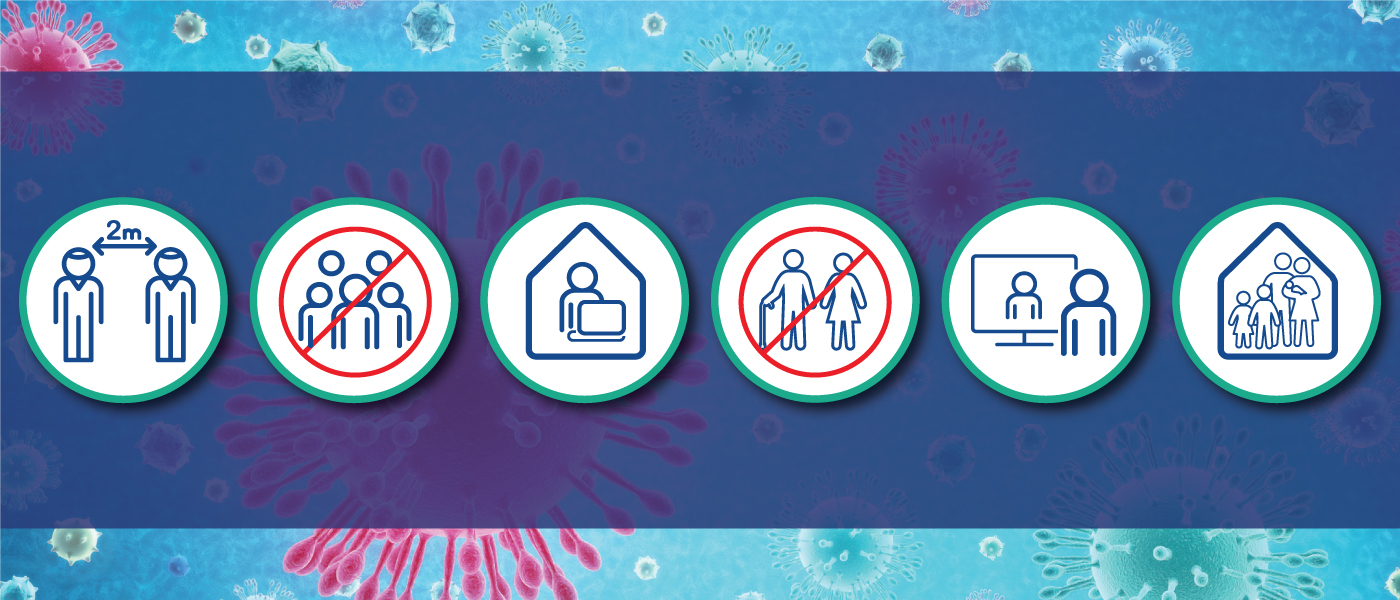
Physical distancing is the reduction of close contacts between people. Close contact is defined as being within two meters of another person. See Ottawa Public Health for more information on recommendations.
If a person who had close contact with 10 people per day before the COVID-19 pandemic now has close contact with three people per day, their physical distancing score is 70 percent. If they have contact with five people per day, their score is 50 percent.
In these projection models, a 70 percent physical distancing scenario means that on average the people of Ottawa have reduced their close contacts by 70 percent. Some people, like essential workers, cannot reduce their number of close contacts.
See model for a technical discussion about how physical distancing affects COVID-19 spread.
Physical distancing effectiveness
Physical distancing effectiveness describes how fast COVID-19 spreads in Ottawa compared to if there was no physical distancing. It is a mathematical calculation based on the observed doubling time (growth) of the hospital census for the previous week.
Physical distancing effectiveness is different from other measures that describe the level of physical distancing, including surveys or community movement statistics.
At the beginning of COVID-19 in Ottawa, new cases (and hospitalizations) doubled every 3 to 4 days. This means that five patients in the hospital on Monday for COVID-19 would increase to 10 patients on Thursday or Friday and then to 20 patients the following week.
As people in Ottawa began to physical distance, the spread of COVID-19 slowed. Less illness meant fewer patients were admitted to the hospital. There was a slower growth or doubling time of patients in hospitals.
If there is perfect or 100% physical distancing effectiveness, there would be no COVID-19 spread. A person with COVID-19 illness would not contact people who can become ill and their infection would not spread past their illness. After a few weeks, COVID-19 would be eliminated from Ottawa; no new patients would be admitted to hospital. The hospital census would gradually decrease as currently admitted patients recovered and were discharged.
Currently, hospital admissions are slower than the initial 3 to 4 days doubling time, but we have not yet eliminated all COVID-19 growth. Physical distancing effectiveness reflects the hospital census that we expect given the observed doubling time.
Note that there is a lag of several weeks between the level of physical distancing and its effect on slowing the growth of COVID-19 illness. There is a further time difference between the onset of illness and hospitalization. Physical distance effectiveness has the same time lag from the onset of distancing to the benefit of distancing showing results in the calculation of physical distancing effectiveness.
See model.