Wastewater plots last updated: 30 March, 2026, 16:35:30
Wastewater samples collected up to: 22 March, 2026
Reported date up to: 30 March, 2026
The website is updated Monday to Friday at approximately 5 p.m. Updates can be delayed if measurements do not pass quality assurance and quality control checks.
Samples that are collected from Monday to Thursday are processed the day after collection. The website and plots are updated the day after processing. Samples that are collected from Friday to Sunday are processed on Monday and thus are posted to the website on Tuesday at 5 p.m.
A method modification was applied on June 8th 2021 to the Ottawa wastewater data set. The magnitudes (not the shape of the curve) from June 8th to present have been retroactively modified on April 12, 2022 to better align the modified method to previous data. The two methods are the same method, with the new method being one that is adapted for settings of lower wastewater detection by processing slightly larger amounts of wastewater. This means that had this new method been applied to the old samples, the amount of virus detected would be proportionally larger.
It is important to remember that the exact meaning of the magnitude of the viral signal is not fully understood, particularly as it is affected by numerous known and unknown factors (eg. the variant in current circulation, the level of immunization in the population, etc.). The most valuable indicator that wastewater follows is actually the relative increase and decrease in overall signal, which tends to precede increases and decreases in hospitalization.
People with COVID-19 shed the causative SARS-CoV-2 virus in their stool, regardless of whether they have symptoms, receive a COVID-19 test or ever are diagnosed. Thus, in contrast to assessing community COVID-19 levels by measuring the number of active cases, which may miss asymptomatic infections as well as be subject to limited test availability, wastewater surveillance consistently captures most of the population with COVID-19 given that everyone goes to the washroom. In addition to serving as a valuable confirmatory data source for COVID-19 levels, wastewater can also serve as early indicator for possible outbreaks, as described below.
For mobile users, dragging the plot while in landscape mode will allow you to view current data. Using the display options at the top allows you to modify the view by zooming in and out of the plot.
Data last reported 2026-03-25. Click here for more details on wastewater data reporting.
*Rolling mean viral signal omits dates (coloured in blue) flagged by wastewater researchers with potential data concerns. Data is currently being studied for effects of snow melt and other diluting factors on RNA signal.
The next plot illustrates the 7-day rolling mean in daily COVID-19 wastewater viral signal. This number is the average of a weekŌĆÖs readings; todayŌĆÖs reading with the previous six days. Also on the graph are various comparators (e.g.┬Āreported daily COVID-19 cases, hospitalization count), which can be individually selected by toggling the menu on the right.
Wastewater Projections
Preliminary projections forecasting viral signal are shown below. Projections forecast normalized viral copies per copy based on observed signal data. Caution is encouraged when interpreting results. Methods have not been peer-reviewed, and validation is ongoing.
Current growth estimates for the amount of virus in wastewater
| measure | estimate |
|---|---|
| Expected change in viral amount | Unsure |
| Rate of growth | 0.14 (0.01 ŌĆō 0.33) |
| Doubling/halving time (days) | 5.1 (2.1 ŌĆō 67) |
Variants of Concern
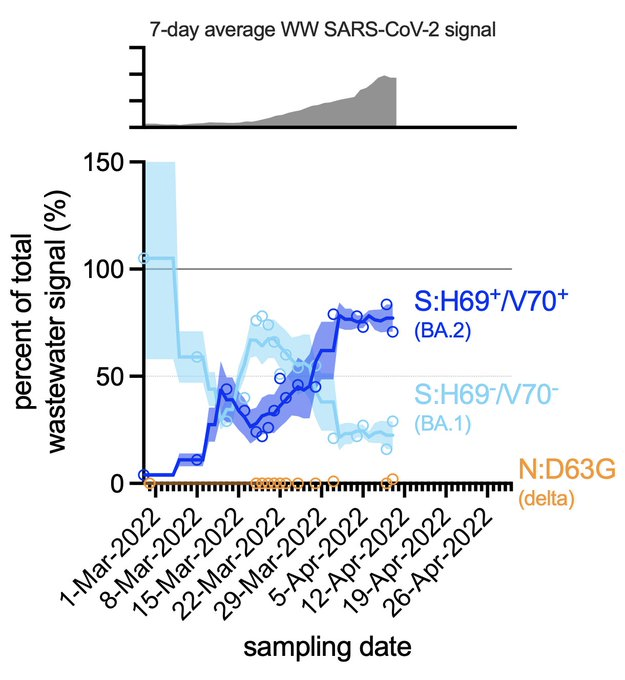
The figure below illustrates the proportion of variants of concern (VOC) found in Ottawa wastewater.
Interpretation cautions
The accuracy and thus reliability of SARS-CoV-2 wastewater testing is improving, as scientists understand more of the role of factors such as differences in sewage systems and laboratory protocols. Nonetheless, we recommend caution when interpreting daily and short-term variation in the viral signal. The level of detection for variant tests is unknown at this time but based on preliminary data, is estimated at more than 100 newly diagnosed or active cases. Research is underway to arrive at a more precise estimate sensitivity. COVID-19 wastewater signal is helpful when interpreted alongside other COVID-19 surveillance measures, taking into consideration the strengths and limitations of each measure.
See the Methods page for more information on how the samples were collected, access to the data, and how the plots were created. The plots are currently for research only and presented to the public for discussion.
You can learn more about wastewater epidemiology and its role in COVID-19 surveillance on Ottawa Public HealthŌĆÖs website.
Definitions
* A 7-day average is generated by averaging the levels from a given day with the six previous days. The average is termed ŌĆ£rollingŌĆØ as it changes each day.
* For new cases, the reported date is the day the test result is reported by the laboratory. Episode date is the approximate date of COVID-19 infection estimated from information available: the date of symptom onset, test date, or the reported date.
* Percent positivity refers to the percentage of individuals tested for COVID-19 infection in a given day that test positive.
* A central question in wastewater epidemiology is determining the proportion of the wastewater that is actually from humans and the proportion that is rain water, snow melt etc. To address this issue, viral copy data is thus normalized using a seasonally stable fecal biomarker; pepper mild mottle virus (PMMoV). See methods for more details.
^ Percent change in 7-day average is calculated by comparing the 7-day average (previous day 1 to 7) with a lagged 7-day average (days 8 to 14).